
Why the Biggest Target-Date Funds Have Underperformed
The answer is surprising—and deeply ironic.
/s3.amazonaws.com/arc-authors/morningstar/1aafbfcc-e9cb-40cc-afaa-43cada43a932.jpg)

Vanguard and Fidelity
Morningstar tracks 53 target-date fund series, run by 29 companies. Among that group, the two largest families dominate, as Vanguard and Fidelity manage more than half the industry’s target-date fund assets.
The performances of those two target-date series are therefore critical to the category’s success. Unfortunately, the returns of both families’ target-date funds have trailed those of their balanced funds. Had target-date funds never been invented, and Vanguard and Fidelity had instead placed their 401(k) shareholders into their existing balanced funds, those investors would be significantly wealthier today.
The Return Gap
That statement applies over all meaningful trailing periods: five years, 10 years, and 15 years. It also applies for the 19 years and nine months since the initial Vanguard target-date funds were launched, and for the 26 years and nine months since Fidelity’s earliest series debuted. Across the board, the companies’ balanced funds have earned more.
The chart below shows 15-year comparisons through December 2022. (These are the mutual fund totals. Both companies also offer target-date strategies that are structured as collective investment trusts. Those funds have performed slightly better on account of their lower costs, but not so well as to alter the findings.)
Target-Date Funds Have Lagged
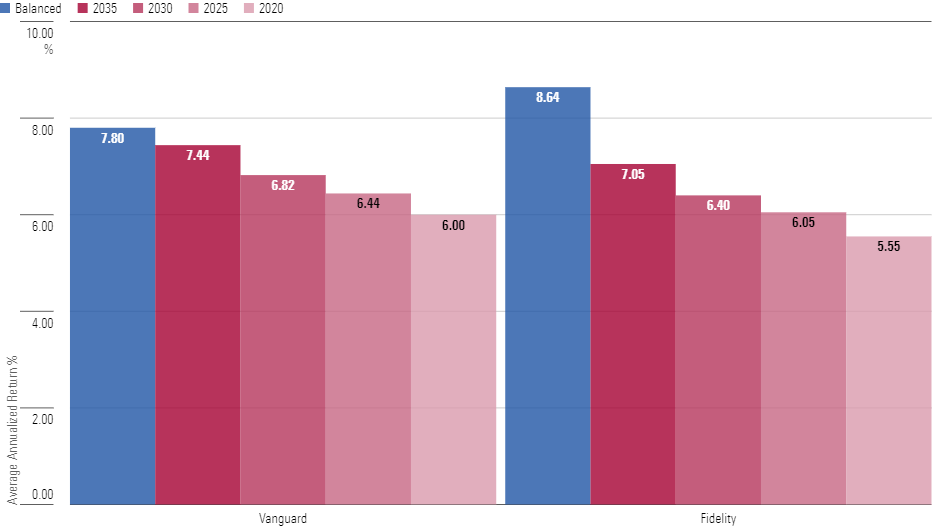
More Stocks?
Presumably, the balanced funds owned more equities. Over almost any 15-year period in recent decades, stocks have outgained bonds, and 2008-22 was no exception. Despite being bookended by bear markets, the Morningstar US Market Index returned an annualized 8.75%, while bond indexes managed only about 3%. Thus, funds that held more stocks enjoyed a huge advantage.
Such is the usual explanation for performance differences among allocation funds—but not in this case. On average, Vanguard Balanced Index VBINX held fewer stocks through those 15 years than did any of the featured target-date funds, save for Vanguard Target Retirement 2020 VTWNX, which it matched. For its part, Fidelity Balanced FBALX placed in the middle, possessing fewer equities than the two longer-dated target-date funds but more than their shorter-dated siblings.
Target-Date Funds Had Enough Equities
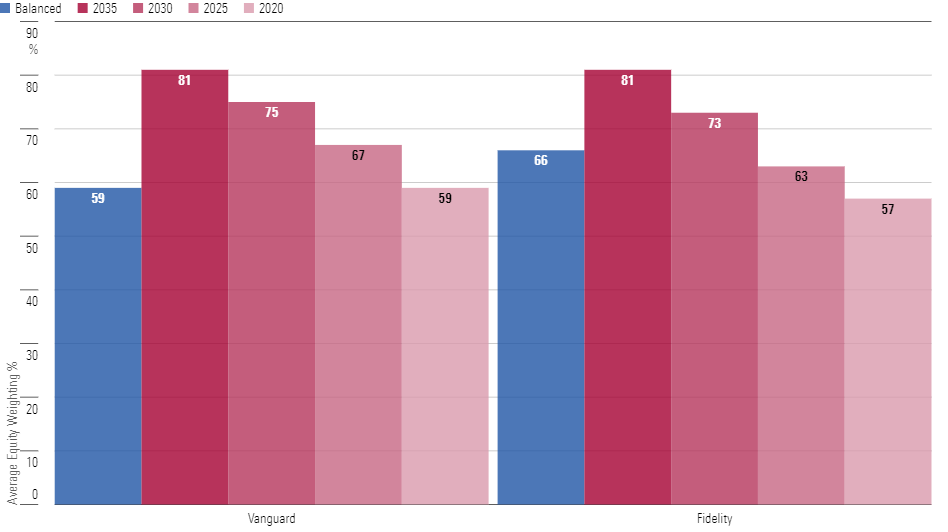
Nor does the timing of equity returns explain the discrepancy. It’s true that stocks performed worst at the start of the 15-year period, when the target-date funds were most boldly positioned. However, the highest stock market gains came during the middle five years, when almost all the target-date funds owned more equities than the balanced funds. Also, as the balanced funds posted stronger returns over the trailing 10 years, the timing argument fails on that account.
Home-Court Advantage
As it turns out, balanced funds triumphed not because of their overall equity exposure, or the timing of their equity allocations, but instead because of their investments in foreign stocks—more specifically, their lack of foreign stocks. On average, only 12% of Fidelity Balanced’s stock weighting came from outside the United States. And Vanguard Balanced skipped non-U.S. stocks entirely.
That contrasts sharply with the strategies employed by the companies’ target-date funds. With both Vanguard and Fidelity, international equities accounted for about one third of their target-date funds’ stock exposures. Such levels dwarfed those of the balanced funds.
Home and Away
(Average Non-U.S. Equity Weighting, as a % of Equity Assets, 2008-22)
| Vanguard | Average Non-U.S. Equity Weighting | Fidelity | Average Non-U.S. Equity Weighting | |
|---|---|---|---|---|
| Target-Date Funds | 32% | Target-Date Funds | 36% | |
| Balanced Index | 0% | Balanced Index | 12% |
Testing the Proposition
That the foreign stock decision drove the outcome can be demonstrated by the following exercise. For each of the 15 calendar years, I calculated each fund’s “expected return” as follows:
1) Assume the fund’s Jan. 1 U.S. equity weighting never changes and earns exactly the return of Morningstar US Market Index.
2) Assume the fund’s Jan. 1 non-U.S. equity weighting never changes and earns exactly the return of Morningstar Global ex US Index.
3) Assume that the remainder of the fund’s Jan. 1 weighting never changes and earns exactly the return of Morningstar US Core Bond Index.
My favorite type of technique: simple but effective. In aggregate, each fund’s actual results closely match its projected expected returns. The table below provides the average annualized differences; a positive number indicates that the fund beat the expectation, while a negative figure shows the opposite.
Actual Returns Versus Expected Returns
(Average Annualized %, 2008-22)
| Vanguard | Difference | Fidelity | Difference | |
|---|---|---|---|---|
| Target 2030 | 0.24 | Balanced | 0.44 | |
| Target 2020 | 0.22 | Freedom 2025 | -0.08 | |
| Balanced | -0.01 | Freedom 2020 | -0.17 | |
| Target 2035 | -0.25 | Freedom 2030 | -0.17 | |
| Target 2025 | -0.28 | Freedom 2035 | -0.21 |
That Vanguard Balanced Index posted a neutral score was foreseeable, considering the fund owns a fixed blend of the securities that constitute 1) Vanguard Total Stock Market Index VTSMX and 2) Vanguard Total Bond Market Index VBMFX. Nor is it remarkable that the company’s target-date funds are also clustered near zero, as they are collections of index funds. With Vanguard, the explanation for its target-date funds’ underperformance would necessarily come from asset allocation, not security selection.
Not so for Fidelity’s funds, as they are actively managed. Conceivably, its target-date funds could have trailed Fidelity Balanced because the target-date funds were badly run, or because Fidelity Balanced was brilliantly managed, or some combination thereof. However, the actual explanation is that while Fidelity Balanced has indeed been well-governed, most of the performance difference arises from asset allocation. After controlling for allocation, the results for Fidelity’s target-date funds are barely negative.
(As none of these results include the effect of expenses, the analysis suggests that Fidelity’s target-date funds modestly benefited from security selection.)
The Best-Laid Plans
So much for the surprise, now comes the paradox. The reason Vanguard’s and Fidelity’s target-date funds invest much more heavily in non-U.S. stocks than do the companies’ balanced funds is because the former are vetted by institutional investors. Target-date funds are sold almost exclusively through 401(k) plans, which must meet institutional demands, which include the stipulation that the funds be internationally diversified.
Consequently, every one of those 53 target-date funds invests at least 20% of its equity assets in non-U.S. securities. (The median position is 35%.) Meanwhile, because they are primarily bought by retail investors, balanced funds face no such constraints and may invest entirely within the United States.
In other words, Vanguard and Fidelity’s target-date funds have failed to keep pace with their organizations’ balanced funds not because they are managed to lower standards, but because they are held to higher ones. Isn’t it ironic?
The opinions expressed here are the author’s. Morningstar values diversity of thought and publishes a broad range of viewpoints.
The author or authors own shares in one or more securities mentioned in this article. Find out about Morningstar’s editorial policies.
/cloudfront-us-east-1.images.arcpublishing.com/morningstar/ZKOY2ZAHLJVJJMCLXHIVFME56M.jpg)
/d10o6nnig0wrdw.cloudfront.net/05-14-2024/t_958dc30e28aa4c8593f13c19505966e3_name_file_960x540_1600_v4_.jpg)
/cloudfront-us-east-1.images.arcpublishing.com/morningstar/OMVK3XQEVFDRHGPHSQPIBDENQE.jpg)
:quality(80)/s3.amazonaws.com/arc-authors/morningstar/1aafbfcc-e9cb-40cc-afaa-43cada43a932.jpg)